The @TwitterTPM team has been exploring ways to visualize work across a number of teams and programs within engineering. One of our key goals is to highlight work that has dependencies and understand whether those dependencies have been met. We’ve arrived at a solution that combines JIRA, GreenHopper and Confluence.
Ancient TPM proverb: “a watched JIRA never moves”
— Twitter TPM Team ( @TwitterTPM) August 12, 2013
First, some context: across Twitter, we set quarterly goals for the company, each department (e.g. Engineering), and each team within a department. The company goals are shared by everyone, and every team is focused on supporting them. The name for this practice of setting quarterly goals is called Gulls (it’s a bird, get it?).
Recently, we set out to make it easier for employees to update their Gulls and provide greater transparency across teams. In doing so, a positive side effect has been increased visibility into dependencies. So how did we approach this?
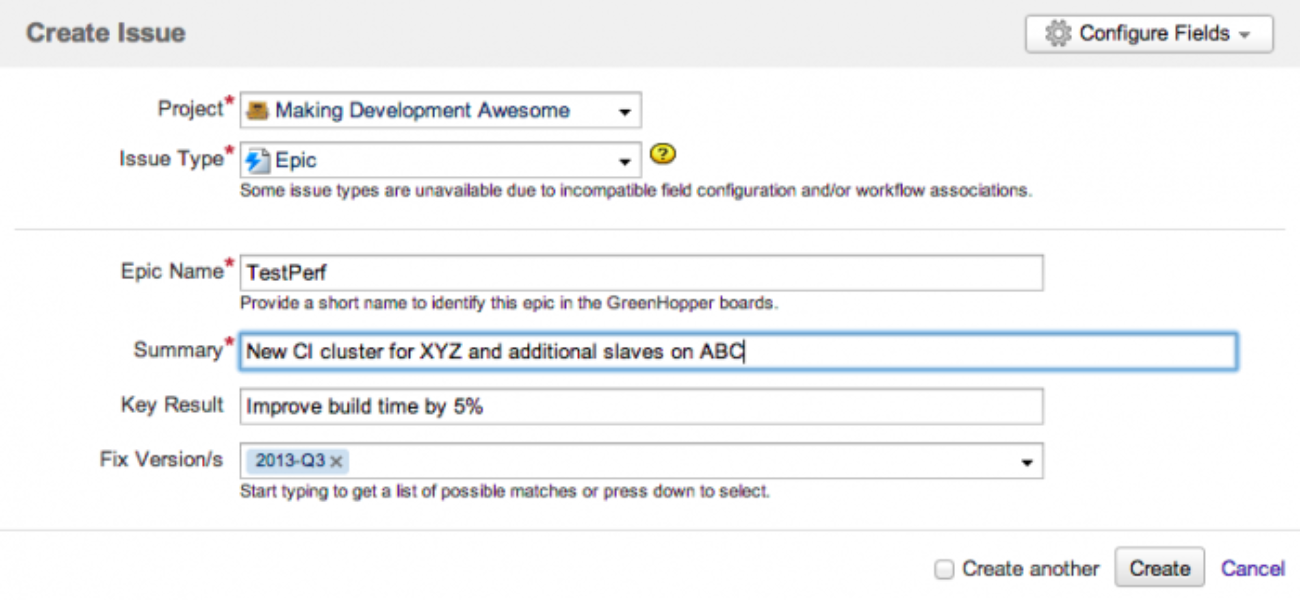
Each engineering team has its own project in JIRA within which they prioritize the backlog, plan sprints, and measure progress. Each quarter, a team identifies its Key Results and records those using the Epic issue type in JIRA.
Since teams plan one or two quarters ahead, we needed a way to track what the team was targeting for the current quarter –– we chose JIRA Fix Versions for the quarters - 2013-Q3, 2013-Q4, etc. Finally, we added a Text Custom Field to JIRA called ‘Key Result’ and added it to the Epic issue type.
The one other key change we made to JIRA to support tracking progress of these Epics was to create a specific workflow for Gulls. We now have four steps in the workflow for an Epic: Open, Accepted, In Progress and Resolved.
 Finally, we order the Epics in JIRA to ensure that the order is correct, focusing on delivering the highest value items first. Whenever we report on the goals we always use the JQL (JIRA Query Language) clause ORDER BY Rank ASC to ensure they are always displayed in the correct order.
To visualize progress toward the Epics’ completion, we selected two options that fit the needs of particular audiences: Kanban for engineering and Confluence for non-engineering.
Engineering
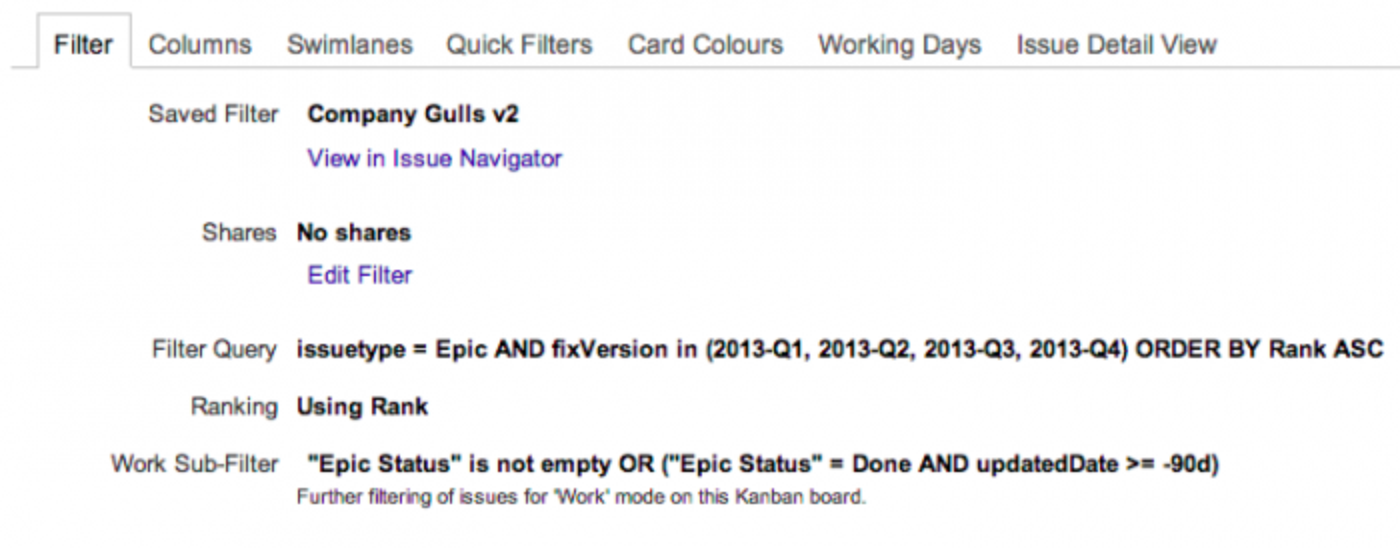
In engineering, we tend to want to look at details and dependencies, so we selected Kanban boards in GreenHopper to visualize Epics and their current status. Here’s an example:

We leverage the Quick Filters, Swimlanes and Card Colours provided by JIRA to get the visualization we want. For instance, we’re only getting the Epics related to the Gulls practice, teams can continue to use Epics for managing other work so long as it does not have a Fix Version for one of the quarters, e.g. 2013-Q3.

Note: The Work Sub-Filter removes the Epics completed in the last quarter off the Work mode of the board. They are still available on the Report mode for Cycle Time metrics (more on this below).
Non-Engineering
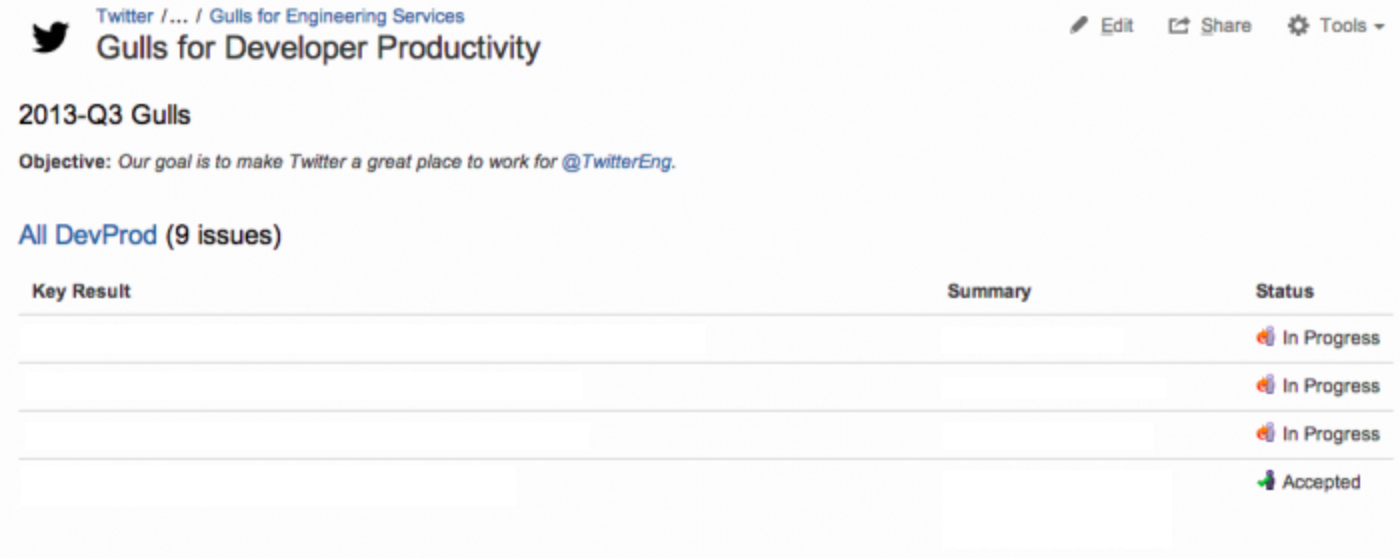
Teams outside of engineering tend to prefer to see a high-level overview of the projects that engineers are working on. For those teams, we use a page in Confluence to show show progress. Objectives, which may span multiple quarters, are captured on the Confluence page, and Key Results, which are in Epics in JIRA, are introduced using the JIRA Issues macro.

We manage dependencies in two ways. First, we identify the instances where a team has a dependency on a particular service that a different team still has to build. If, for example, Team A has a goal that depends on Service X, which Team B is still working on, then Team A should defer that goal until the next quarter. Only if Team B delivers Service X early should Team A consider pulling that goal in to the current quarter.
Second, we leverage tools to visualize incoming and outgoing dependencies for a team so it’s easy to track them. We want to highlight those goals that are blocked. The Script Runner add-on for JIRA saves the day when it comes to helping find dependencies and making sure teams are aware that other teams depend on them. Script Runner provides some fancy JQL clauses, and we use the following Quick Filter on the Kanban board (for Engineering):
(issueFunction in hasLinks("depends on") OR issueFunction in hasLinks("is a dependent of")) AND status in (Accepted, "In Progress")
This query shows all Epics that are Accepted or In Progress that have an incoming or outgoing dependency.

And voila, we can visualize Epics across the company and highlight the blockers. You can even turn this into a nifty JIRA Wallboard and put on screens around the office.
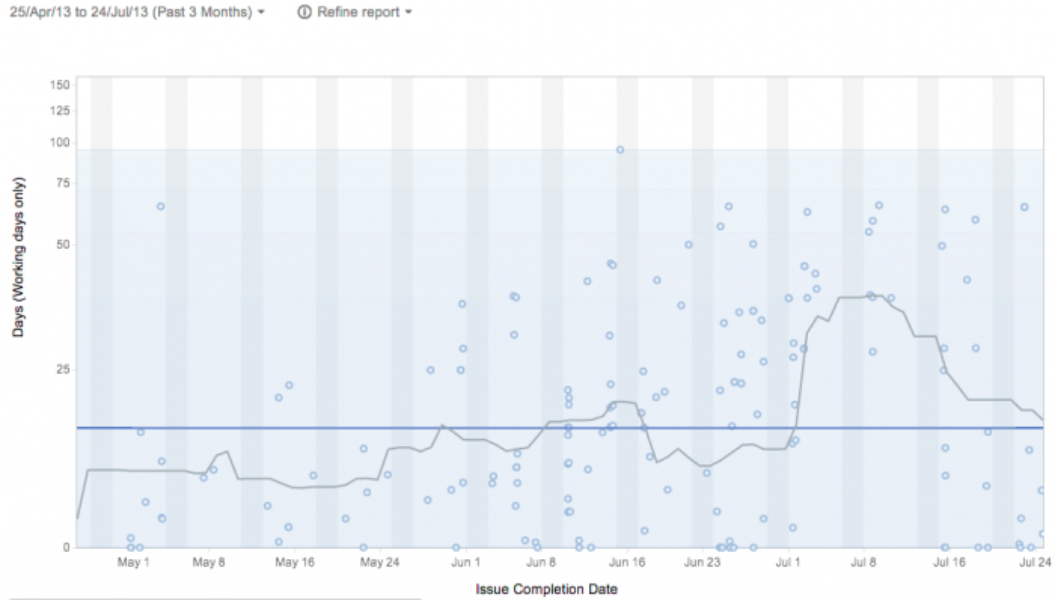
Cycle time is the amount of time that an issue spends marked as In Progress –– in this case, that’s the amount of time an Epic takes to be completed from when we start working on it. We use the Control Chart to visualize this.

You can see in the control chart above the amount of time taken to complete an Epic increased during the 4th July week and following HackWeek.
We’re going to drive this further. One of the pieces we’re exploring is using the open source Foresight add-on for JIRA to visualize dependencies on an aggregate level. And you’ll want to stay tuned for a future blog on our use of the Presentation add-on for Confluence.
Providing clear and early visibility for management and partners is a great way for engineering teams to plan a backlog, tie it to the roadmap, simplify dependency tracking, and minimize disruptions. If all the information is there in JIRA, we can package it up as something that makes sense for people throughout the company.
What else could we be doing? What are we missing? How do you do it? We’d love to hear from you. Reach out to us @TwitterTPM.
Did someone say … cookies?
X and its partners use cookies to provide you with a better, safer and
faster service and to support our business. Some cookies are necessary to use
our services, improve our services, and make sure they work properly.
Show more about your choices.