Spotlight
Measuring campaign success with the Red Cross
By
Thursday, 9 June 2016
This blog post is the first in a series of stories highlighting unique and interesting applications of Gnip’s Engagement API. We only just announced the general availability release of the Engagement API a month ago and we are already hearing some really impressive ways that organizations are using it to improve their efforts on Twitter.
In this first installation, we are sharing some work that I did in collaboration with the International Committee of the Red Cross (@ICRC). As Developer Advocates, we have the opportunity to become true first-adopters of Gnip’s latest and greatest products. “Eating our own dogfood” by creating sample clients with our newest enterprise data APIs helps us better prepare for customer support needs down the road. Knowing that the ICRC used Twitter in some unique ways in support of their global mission, I decided to reach out to their Digital Communications Unit to learn how access to newly available Twitter impression data from the Engagement API might benefit the organization’s initiatives.
The ability to identify and explore select Tweets based on diverse metrics such as new follows, actual impressions and total engagement was especially valuable to our team. This allows for more precise evaluation of non-paid campaigns on Twitter.
The Engagement API was especially well-positioned to help answer the ICRC’s most common questions around the effectiveness of their campaigns on Twitter. These questions included:
The ICRC currently leverages Twitter in support of a variety of different use cases, ranging from natural disaster response to coordinating relief efforts in war-torn regions to promoting general humanitarian efforts around the globe. Campaign success had previously been measured in terms of Retweets, likes, URL clicks and video views along with an estimated value of “potential” impressions.
Working with Siane Monreal and Yan Luong from the ICRC’s Digital Communications Unit, we proposed using a sample Engagement API client to gain deeper insight about the more than 2,500 @ICRC Tweets posted since September 2014. The ICRC was very interested in learning what the more granular and new set of engagement metrics from the API client might tell them about the performance of their historical Twitter content to date. Building this Engagement API client meant that the team would then have a more reliable measure of “Total Impressions” rather than the estimation of “potential reach” (based on summing follower graph counts) employed prior to the availability of new data from the API.
For us, the fact that we could move from potential impressions to the true measurement of views for a Tweet was key.
With the sample Engagement API client we were able to quickly generate insightful - and actionable - metrics about ICRC’s Tweets. The result was that they were able to quickly measure the performance of thousands of historical @ICRC Tweets to learn how they might improve the content and messaging behind new Tweets moving forward.
If you’d like to learn more about the design and build process behind my sample Engagement API client - as well as some surprising discoveries we made with the ICRC along the way - keep reading my developer notes below.
Or if you want to skip ahead and learn first-hand how simple it is to integrate the Engagement API with your current offerings to unlock new customer value, please contact your Twitter data account manager or reach out to us at [email protected] today!
The good news for developers is that integrating with the Engagement API is very straightforward and quick to do. In fact, we’ve heard of customer-facing solutions integrating with the API in just a few hours time. A key first step is to review our technical documentation at support.gnip.com, where you can learn more about the three endpoints provided by the Engagement API, the different types of metrics available and the flexible ways you can organize your data with Engagement Groupings.
I set out to develop this sample Engagement API client in Ruby with a few key “user stories” in mind. As a consumer of Engagement API data, I wanted an application that could:
The end result was this open-sourced sample application available on TwitterDev’s GitHub account. The project’s README discusses importing Tweet IDs, configuring the application and more code details. You should check it out if you are looking for a jumpstart on integrating with the Engagement API. Even if you do not use Ruby, we are sure that the README will provide useful documentation for any API integrator.
The Engagement API includes a /totals endpoint that provides the grand total of Retweets, likes and replies for any Tweet posted since September 1, 2014 for owned accounts and the lasts 90-days for public accounts. Two other engagement metrics are available in the /totals endpoint including impressions and engagements for Tweets posted within the past 90 days, but keep in mind that this data is available only for owned accounts. The first step was to collect the ~2500 Tweets from the @ICRC account since that date using Gnip’s Full-Archive Search API (with this sample API client).
The /totals endpoint supports 250 Tweets per request, so metrics for this Tweet collection required ten requests which took only a few seconds to complete. While the client managed the API requests, it compiled the top ten Tweets based on impressions, total engagements, Retweets, likes and replies.
This step revealed that the following Tweet was the top Tweet in all of those categories:
Other Tweets in the top ten included calls for cease-fires in Yemen, Tweets in support of all migrants and refugees, joint statements with the United Nations and outcry after atrocities committed in Yemen and Afghanistan.
The next step was to submit the Tweet ID of the top Tweet to the /historical endpoint and retrieve the full set of 16 available engagement metrics. The /historical endpoint supports up to 28 days per request, which is plenty since Tweet engagements tend to decrease significantly within a few days of being created. This Tweet was posted on April 25, 2015, so the /historical endpoint was used to retrieve metric totals for the 28 days following that time. For that period, the metrics retrieved included the following:
Next, the Engagement API was used to generate time-series metadata of this Tweet’s metrics. The API provides a flexible way for specifying how you want the data arranged in the server responses. Available Engagement Groupings include two that are used to generate time-series data: engagement.day and engagement.hour. These can be used separately or together depending on the time-series type of interest.
To generate daily totals, a Grouping with the following values is included in the request:
"groupings": {
      "timeseries_daily": {
        "group_by": [
          "tweet.id",
          "engagement.type",
          "engagement.day"
        ]
      }
    }
Groupings are applied in the order specified, so this “timeseries_daily” grouping will organize the metrics first by Tweet ID, then by metric type, then by day. The “timeseries_daily” key is customizable and is used to label the metrics in the server response. As you develop client-side code to post-process the metrics, your parser will need to reference the keys you specify in the Groupings.
With the sample Engagement API client application, all Engagement Types and Groupings are specified in YAML, so the equivalent Grouping is:
engagement_groupings:
timeseries_daily:
- tweet.id
- engagement.type
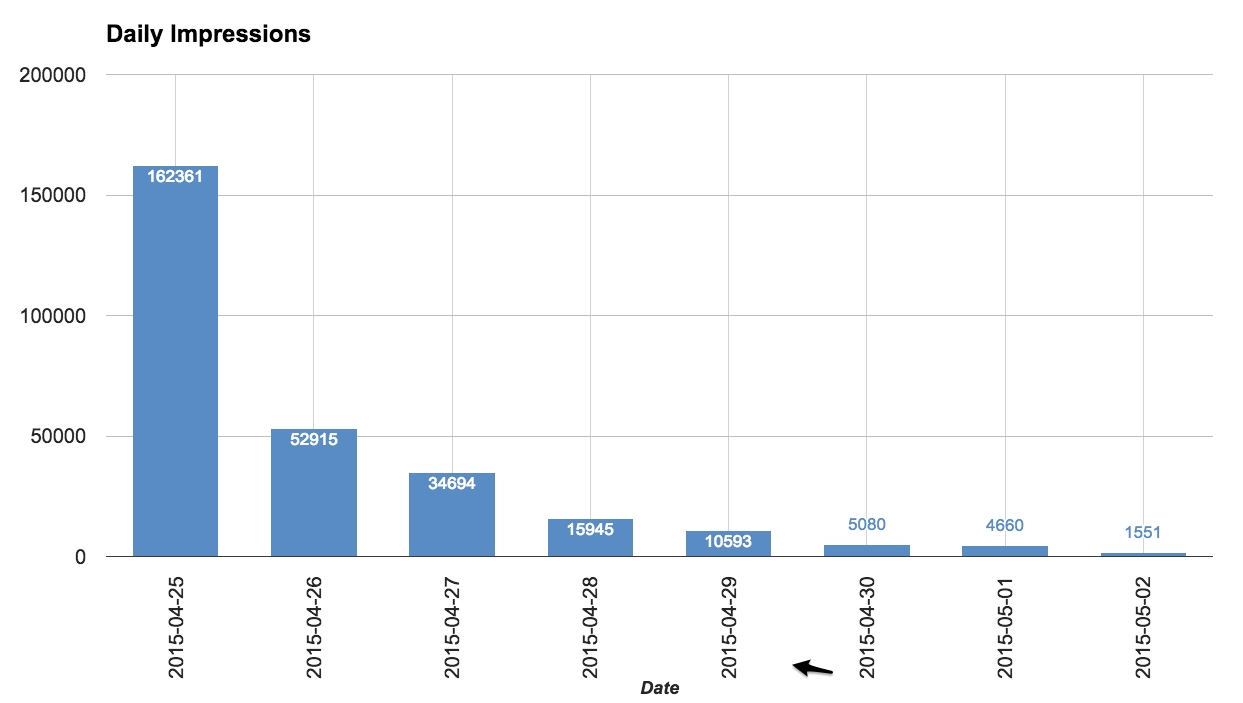
- engagement.dayHere are the resulting daily impressions for the eight days following the Tweet’s posting:
If you have a Grouping with just the engagement.hour value, the API will return metrics in an ‘hour of day’ time-series. For some use-cases this type of time-series may help inform optimal timing for posting Tweets. To configure the Engagement API client for ‘hour of day’ time-series, include the following in the Groupings:
hour_of_day:
- tweet.id
- engagement.type
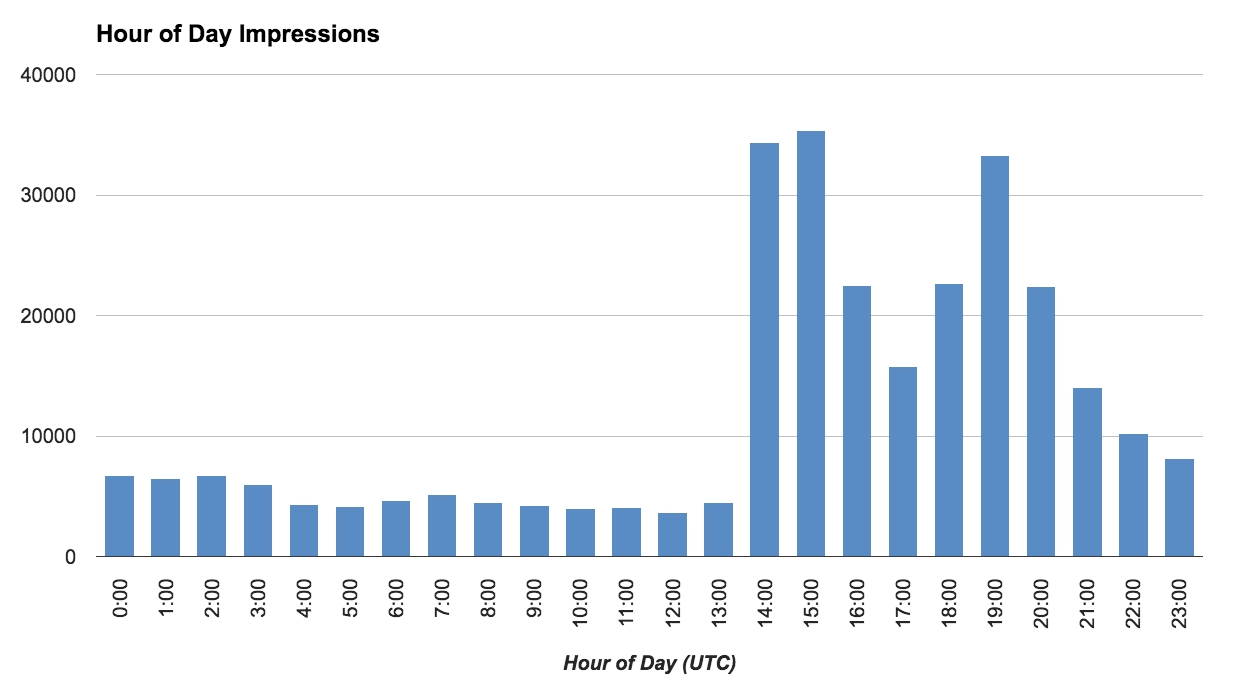
- engagement.hourThe graph below shows the hour-of-day impressions for the Nepal earthquake Tweet. The above Tweet was posted at 14:13 UTC, and the results show below that the top two hours were 14:00-16:00 UTC.
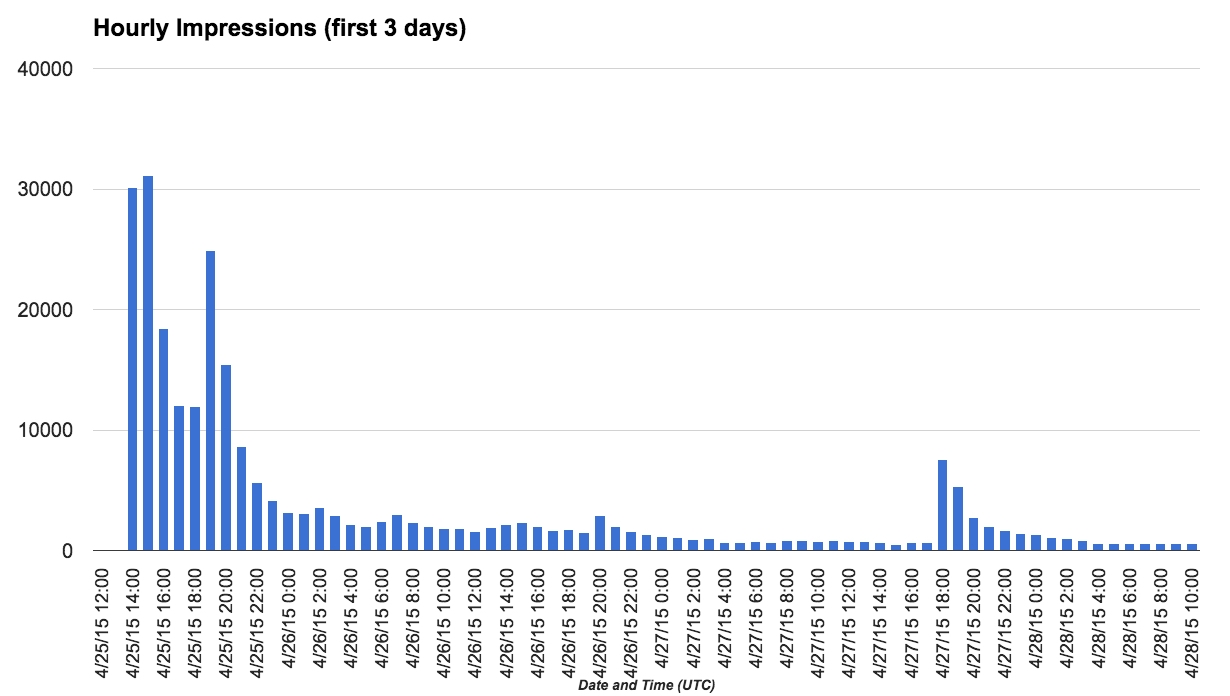
When these two Groupings values are used together you can generate a hour-by-hour time-series. With the following Grouping you can generate the hourly time-series data shown below.
timeseries_hourly:
  - tweet.id
  - engagement.type
  - engagement.day
  - engagement.hour
When requesting hourly time-series data, the Engagement API returns the metrics in JSON with day timestamp and ‘hour of day’ keys:
"impressions": {
      "591968188423897088": {
        "2015-04-25": {
          "14": "30084",
          "15": "31079",
          "16": "18386",
          ...
        }
This script provides example code to reformat these data into simple CSVs with standard timestamps (e.g., ‘2015-04-25 14:00’) making it easy to import into R, spreadsheet, or database software.
From the hourly time-series we see that there was a spike in impressions on the third day after the Tweet was posted. We turned to Gnip’s Full-Archive Search API to further investigate the source of this impressions event. Working off the assumption that this was due to a Retweet by an account with a large number of followers, a single search request confirmed that this event was due to a Retweet by pop star David Archuleta. Celebrity influence and amplification in action!
This exercise is a great example of how the different Gnip APIs can be used together to dig deeper into your Twitter data to learn how you can refine and improve your campaign efforts on the platform.
We look forward to seeing other example API clients, in other languages and with new and different functionality. We are excited to see how our partners and clients integrate these metrics to deliver a new level of Twitter data analysis. Contact our team to see if using the Engagement API makes sense for your use-case, and then download the sample code to start generating metrics to help inform and improve your campaigns.
Did someone say … cookies?
X and its partners use cookies to provide you with a better, safer and
faster service and to support our business. Some cookies are necessary to use
our services, improve our services, and make sure they work properly.
Show more about your choices.